
Forecasting the Box Gum Woodland (Inland Slopes) market
This is a first forward-looking view for a single BOS market, we’re publishing before it is finished to get your input.
What this is, and what it is not
This is an experimental scenario analysis, not a price prediction. We have not landed on a single forecast number, what we’ve done is take one of the scheme’s most active markets, set out the forces most likely to move it, and trace where a few plausible combinations of those forces would lead over the next five years.
Think of it as a discussion starter with the maths shown. The value is in the structure and the assumptions we’re putting in front of the market to test.
About the market
The market is the ecosystem credits in the White Box–Yellow Box–Blakely’s Red Gum, Grassy Woodland Offset Trading Group in the Inland Slopes subregion. It is a critically endangered ecological community and one of the most active ecosystem credit markets in the BOS scheme.
A snapshot of the market as it stands:
Retirements (realised demand) have averaged about 4,900 credits a year across 2022–2025, but the pattern is inconsistent with a large pulse in 2024 (roughly 8,900 credits) sits between quieter years either side.
Issuance (new supply) has run at around 3,000 credits a year which is about 40% below the recent retirement rate.
Forward supply is finite but sufficient in the short term. Roughly one year of future retirements is already spoken for within major-project holdings, and around 1.7 years of additional liquidity sits in the Supply Fund and likely-available credits groups.
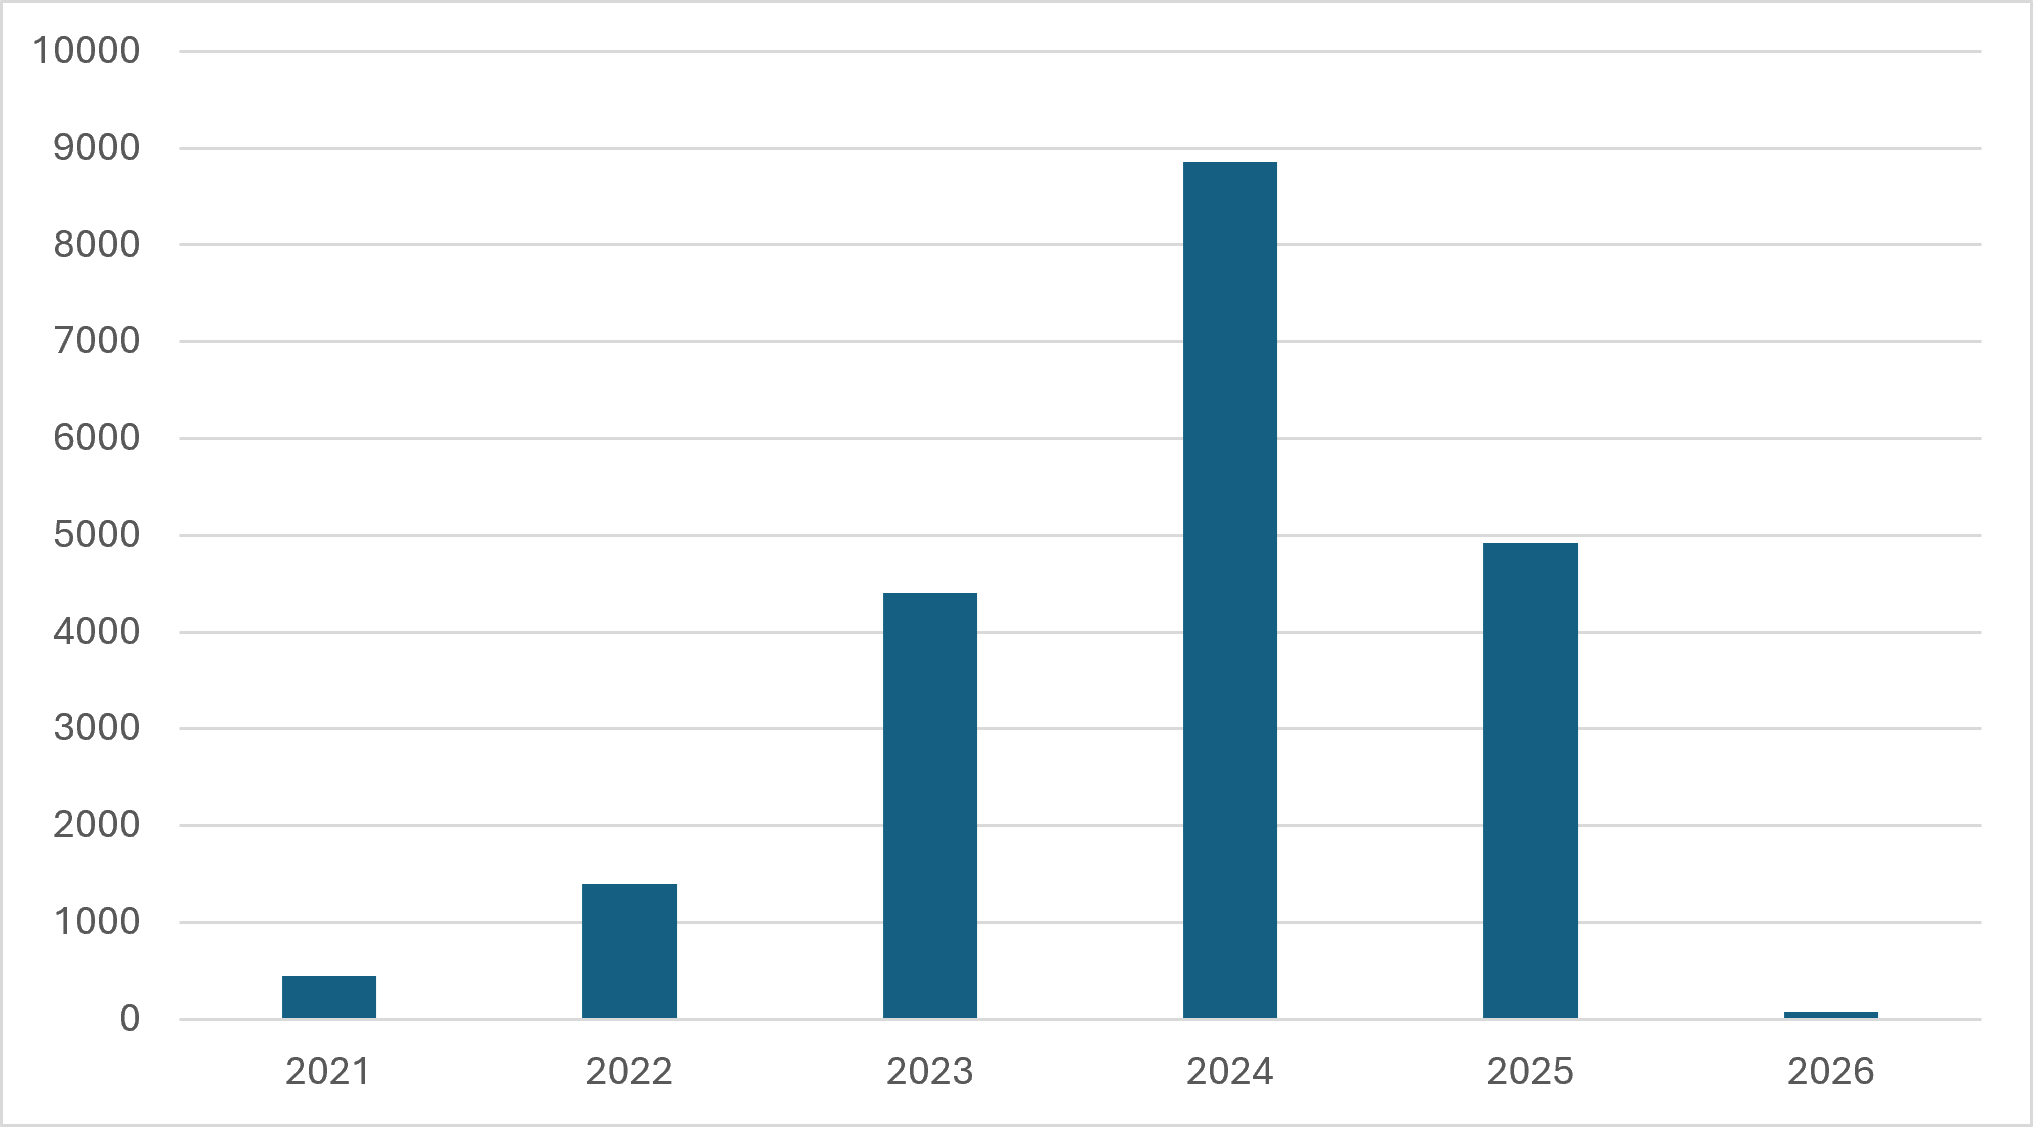
Figure 1 — Annual credit retirements, White Box / Inland Slopes (2021–2026 YTD).
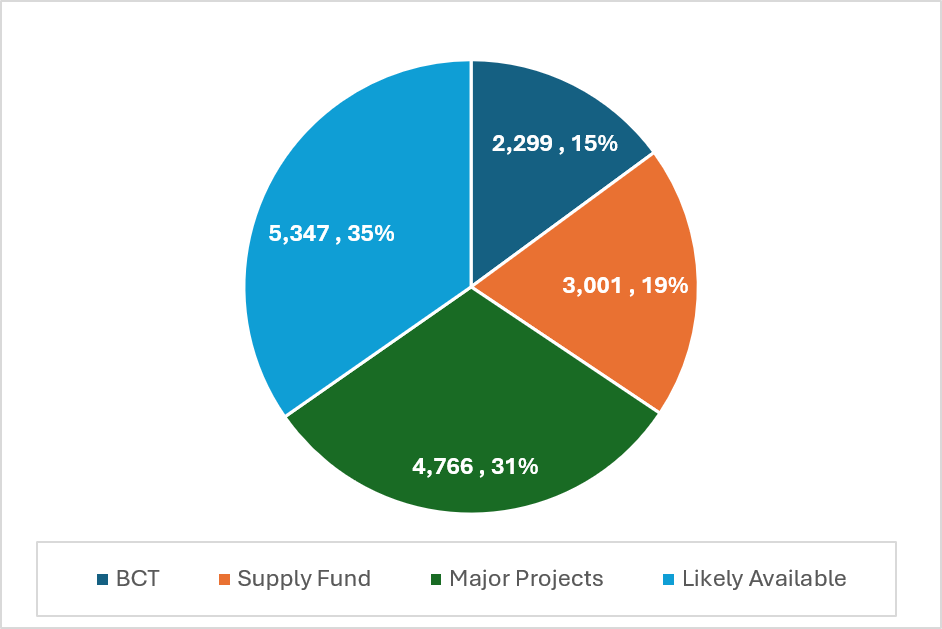
Figure 2 — Available supply by source: BCT, Supply Fund, major-project holdings, and likely-available credits.
That combination of steady-ish demand, thinner issuance, and only a couple of years of visible liquidity is the backdrop to the price story.
The recent price story
The defining feature of this market over several years has been a gradual decline in price. Individual transfers are volatile, but the twelve-month rolling average peaked near $4,835 in 2021 and has drifted down to about $4,050 today. Across the same period it has sat consistently below the BCF charge reference, which has itself eased to around $4,750.
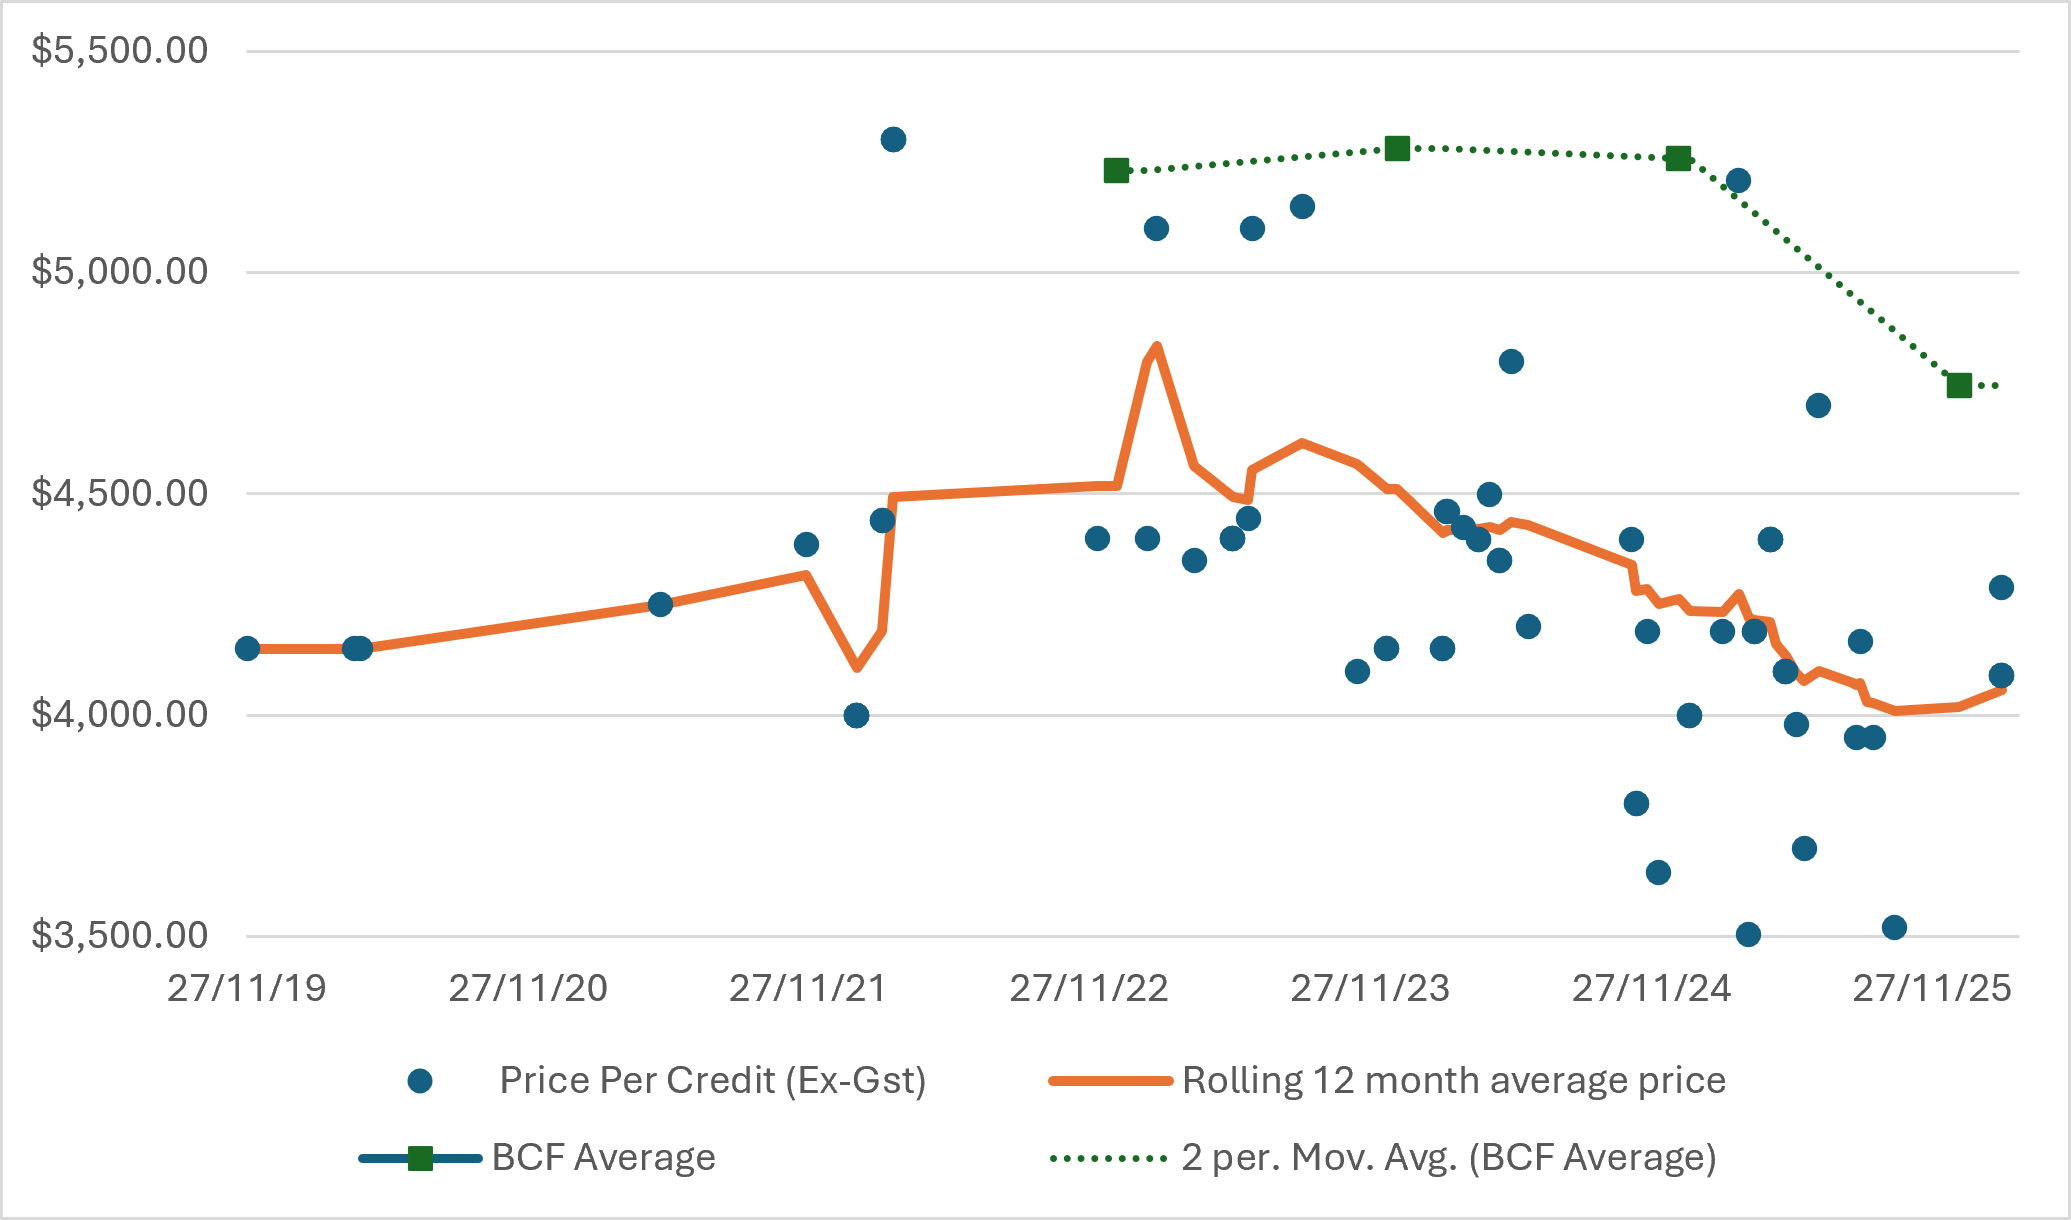
Figure 3 — Market history: transfer prices, 12-month rolling average, and BCF reference (Dec 2019 – early 2026).
The forecast below starts from that current level — roughly $4,050 per credit — and runs to Q1 2031.
Scenario assessment
We built three scenarios, each isolating a different driver, then combined the two that pull hardest against each other.
Scenario 1 — Economic factors lead
Here the credit price simply tracks an underlying economic index — the question being “if credits move with the broader economy, where do they go?” We tested three proxies:
Long term average CPI takes the price to about $4,674 by 2031.
Average rural NSW land value increase takes it to about $5,373.
Local (LGA) land values, which have run exceptionally hard in the wider region, imply as much as $9,484 — a useful upper marker, though a one-to-one link between credit prices and local land inflation is the least likely of the three.
Scenario 1 captures upward pressure — with CPI and NSW land values as the more defensible anchors.
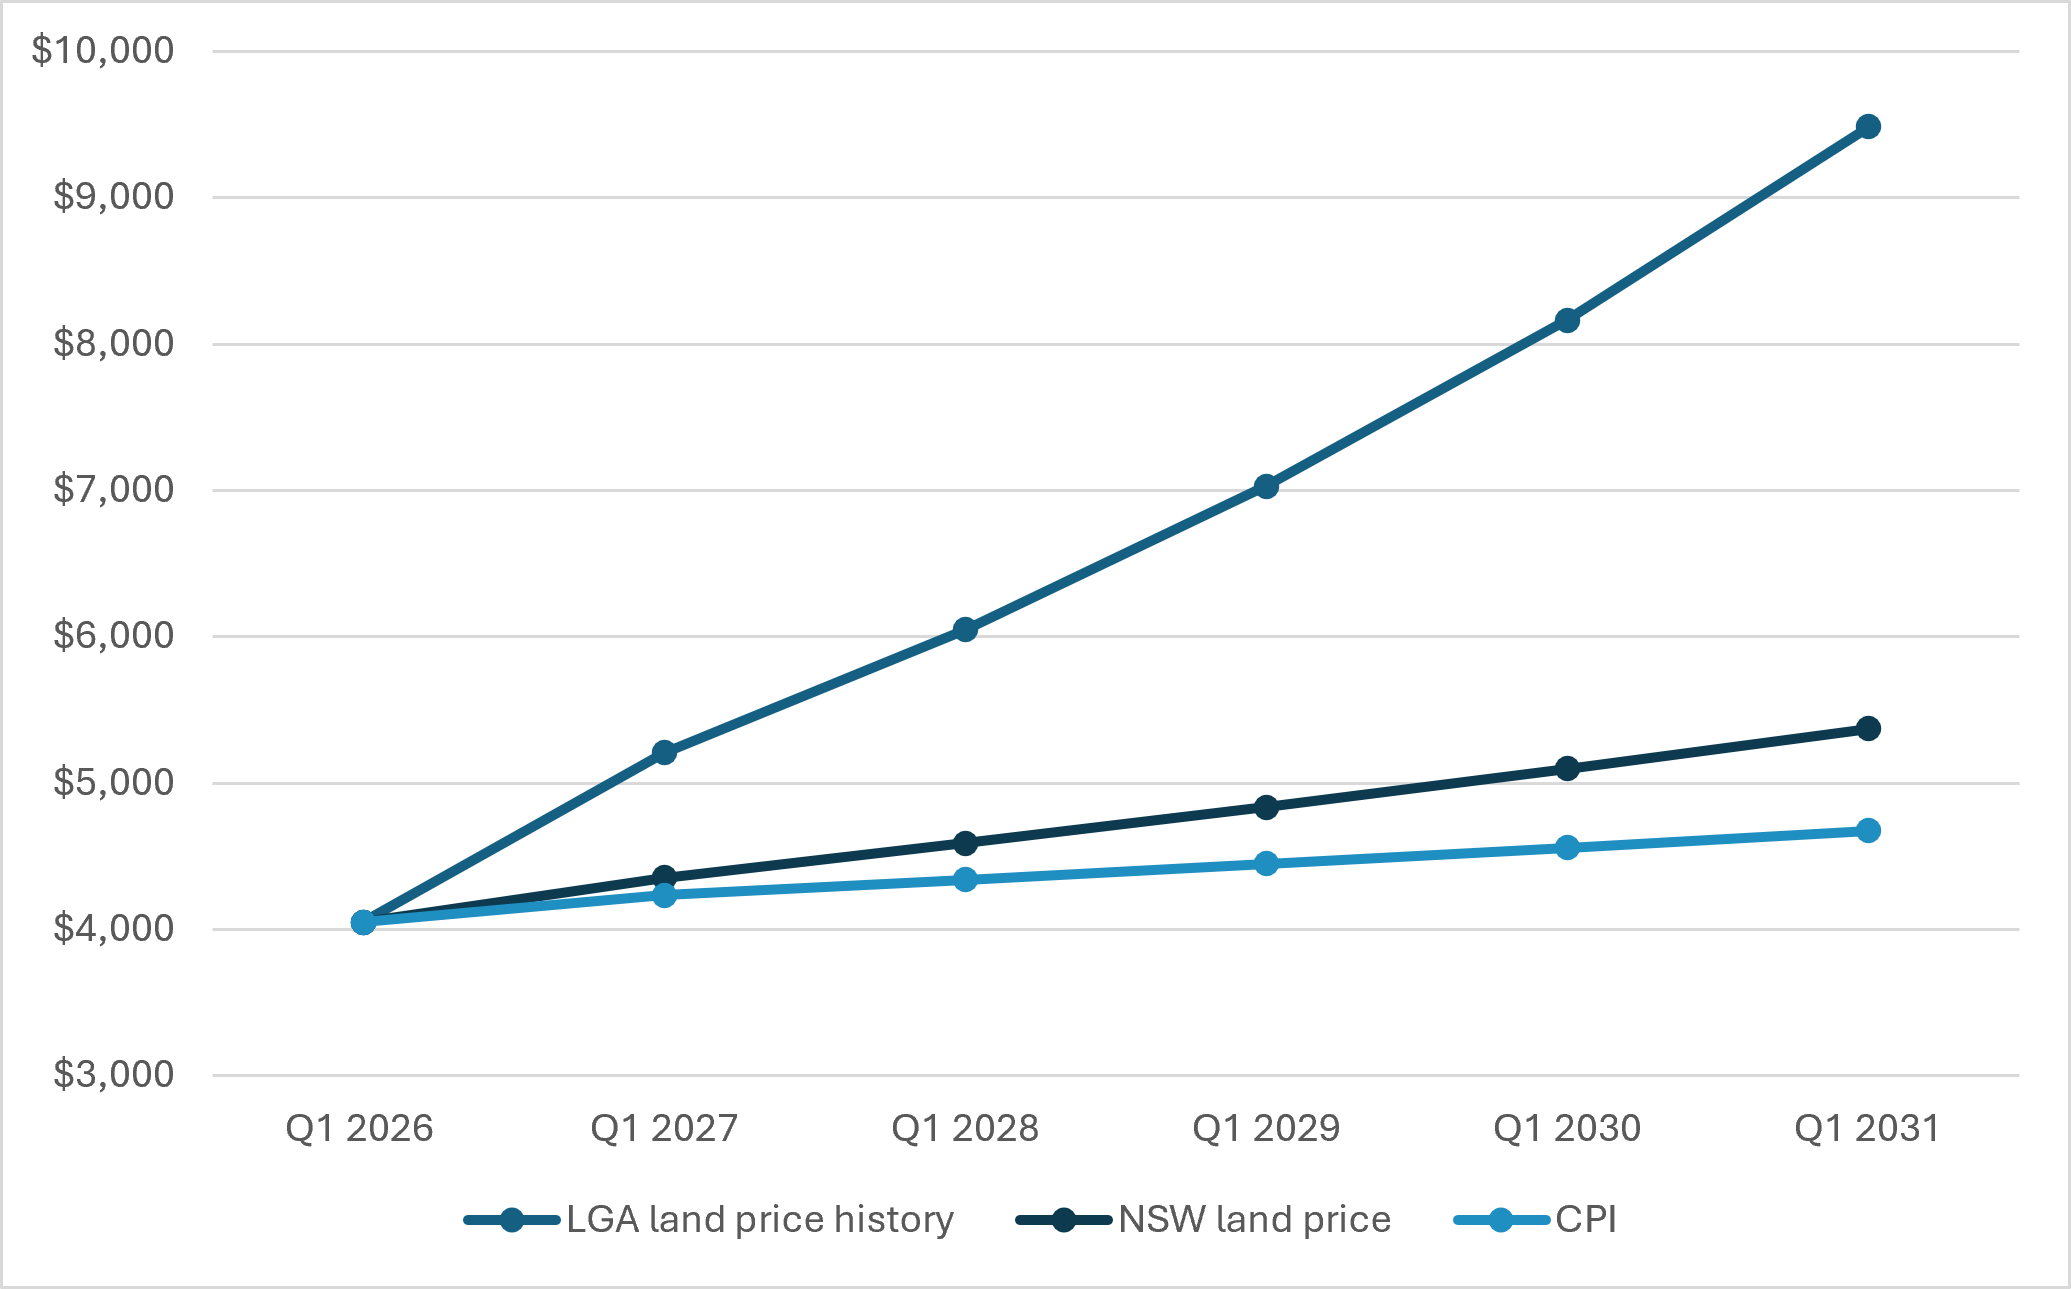
Figure 4 — Scenario 1: credit price tracking economic indices to Q1 2031.
Scenario 2 — The current trend continues
The simplest scenario: extend the observed decline. We ran the current pace of roughly −1% per quarter, alongside a slower case (−0.5%) and an accelerated case (−2%), out to Q1 2031.
On the central trend, the price falls close to a fifth to $3,311 in early 2031, within a range of $2,703 to $3,662 depending on pace.
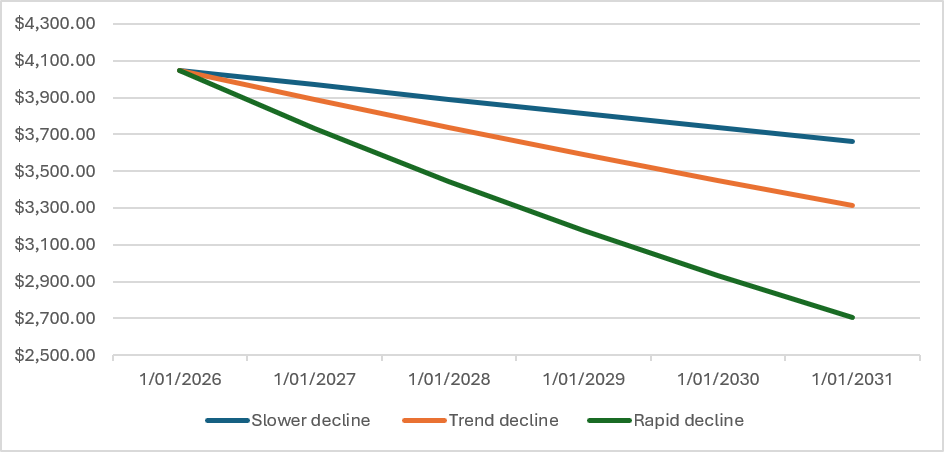
Figure 5 — Scenario 2: trend continuation at three rates of decline.
Scenario 3 — Economic factors and price trend combined
The first two scenarios point in opposite directions, so the third puts them in the same frame to see how the competing forces resolve. The central combined case has prices stabilising and edging up to around $4,342 by early 2031. This is 6% above today, but will represent a nominal decline compared to prices today once inflation is accounted for.
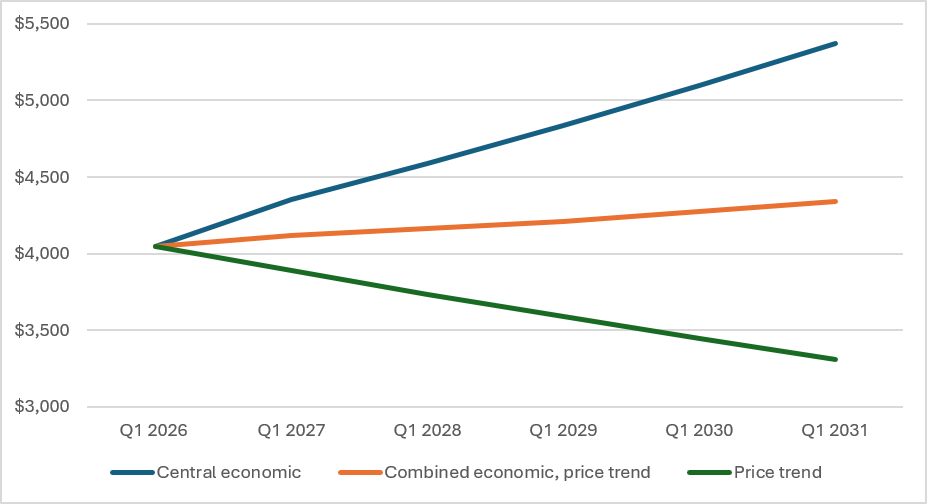
Figure 6 — Scenario 3: economic factors and price trend combined.
Digging deeper — the assumptions on the table
Taken together, these scenarios bound what is plausible over the next three to five years if market conditions stay broadly stable. That stability is an assumption, not a given, and it rests on three others worth naming plainly:
Supply remains sufficient with new issue largely matching future demand. The numbers above rely on 12-15,000 new credits being issued and retired by 2031 in addition to existing supply to meet the historic level of demand.
The price decline reflects the price discovery over time. The decline suggests that over time buyers and sellers have come to better understand the market and build in efficiencies learnt over time.
Economic and policy conditions remain relatively stable. No further shock to inflation, land values or the pace of development in the sectors that drive demand which fundamentally alters the market and its drivers.
Every one of those can be pressure-tested, and each is a place where a better signal would change the picture.
What would turn this into a complete forecast
This initial view tells us where the basic maths leads under stable conditions. Turning it into a forecast means sharpening our view on the things a scenario model has to assume:
Better forward signals on supply and demand. Particularly the shape of demand in the pipeline.
A clearer read on major-project risk. The prospects for existing and new large obligations that shape the market.
The hardest factors to call. Policy change is an on-going disruptor. Environmental markets in Australia have been subject to material changes driven by policy decisions and instability. These changes have impacts supply and demand which in some cases and materially impacted price.
We have initial views on each and are working now on better understanding each of these factors, led by better data.
Over to the market
We’re publishing this because we are keen for your input.
If you trade, advise or hold a position in this market we would love to hear your views on this initial look and what it is missing or how it can be extended across the scheme most productively.
Let us know your thoughts.
Finally, if you need help building a picture to support your current or future investments, get in touch and see how we can accelerate and improve your workplan.
Get in touch, or read how we’re approaching forecasting across the scheme here.
