
Q1 2026 Market Update
Quarterly headline update — prices, volume and retirements across the four credit market segments
A quieter quarter, with steadier prices than the headlines suggest
The first quarter of 2026 was a calmer one for the NSW biodiversity credit market. After an active 2025, the pace of trading eased while underlying prices held broadly steady across most segments. The standout exception was Biobanking species credits, which continued to climb.
It is a quarter where the direction of activity tells a more interesting story than the price tape, and where the difference between the raw public register and properly filtered data is especially stark.
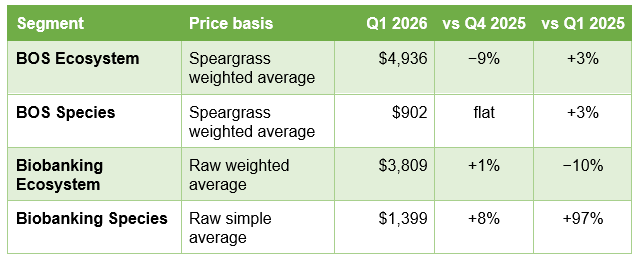
The headline measures, on a consistent basis with our December update, are set out below.
Credit Prices
Transfer Volume and Retirements (rolling 12 months)

BOS prices and transfer volumes are Speargrass figures with non-market transfers removed. Biobanking figures are raw — Speargrass is working on a filtering method to better reflect market values in the Biobanking market.
Prices held steady
The clearest message this quarter is that prices are broadly stable. BOS ecosystem credits eased about 9% on the quarter to a Speargrass average of $4,936, but remain up around 3% on a year earlier — in other words, holding their ground rather than moving in any meaningful direction. BOS species credits were essentially flat, and Biobanking ecosystem credits barely moved.
The single genuine mover was Biobanking species, up 8% on the quarter to $1,399 and up around 97% over the year.
This stability matters because it runs against the impression a casual read of the public transfer register can create. Average prices at the credit market or whole of market level that are drawn straight from the register can swing sharply from quarter to quarter, driven by which credits happened to change hands and by transfers that are not arm’s-length market sales. Filtering those out is what separates a real price signal from noise.
The real story is in the volume of credits traded
While prices were quiet, trading activity moved, and the segments pulled in opposite directions.
The BOS ecosystem transfer market cooled noticeably. On filtered data, rolling twelve-month volume fell around 11% on the quarter and 47% on the year, with quarterly transaction numbers dropping from 75 a year ago to 47. This is the clearest sign of a market taking a breather after a busy 2025.
It is also a good illustration of why filtered data is essential. On the raw register, BOS ecosystem transfer volume looks like it fell by roughly two-thirds over the year. Most of that apparent fall is the roll-off of a small number of very large, very low-priced transfers that were most likely internal major project transfers rather than genuine market sales. The underlying market did soften, but by far less than the unfiltered numbers imply.
The BOS species market, by contrast, was the bright spot. Filtered volume rose about 33% over the year and the number of transactions more than doubled. The market is broadening, with more credit types changing hands and more participants active.
Biobanking ecosystem was stable and quiet. Biobanking species volume was high and rising but concentrated in a handful of very large parcels rather than a deep, liquid market.
What it means for participants
For anyone holding, buying or advising on credits, the takeaway from Q1 2026 is that a steady price headline can sit on top of a market that is changing underneath.
BOS ecosystem prices are holding while the transfer market thins; species markets are broadening; and a growing share of demand is being met away from visible market transfers.
In a market this fragmented with 364 offset trading groups (functioning as thousands of regional markets) and 249 species credit markets, each with its own conditions, the position in any one credit can look nothing like the average.
That is precisely where current, filtered, market-specific information earns its keep. Speargrass tracks every segment of the NSW market and can provide indicative pricing and supply-demand context for any individual credit type.
Prices, volumes and retirements are rolling twelve-month figures to 31 March 2026. BOS figures exclude identified non-market transfers; Biobanking figures are unfiltered. For a pricing or market assessment on a specific credit, contact Speargrass.