
Many markets, not one.
How the NSW biodiversity credit market varies by bioregion
It is tempting to speak of "the price of an ecosystem credit" but there are many markets, and where a credit sits largely determines what it is worth.
The Biodiversity Offsets Scheme matches credits to impacts at the IBRA subregion. An obligation must generally be met with credits of a like ecosystem from the same subregion, or from one adjacent to it. Subregions are the trading unit, and adjacency does not respect the boundaries above them: a subregion on the New England Tableland can be adjacent to subregions on the North Coast. There are 137 subregions in the state, which is another way of saying there are a great many small markets rather than one large one.
We have grouped those subregions into their IBRA bioregions for this analysis. Bioregions are the broad ecological divisions of the continent, not a trading rule. They are useful here because they show what is happening across a general locality. The pattern they reveal is consistent. A handful of coastal and near-coastal bioregions carry almost all of the genuine trading. The large credit holdings of the inland barely change hands at all, for reasons that have little to do with market liquidity. And within the active bioregions, the action narrows further still, down to a few subregions doing most of the work.
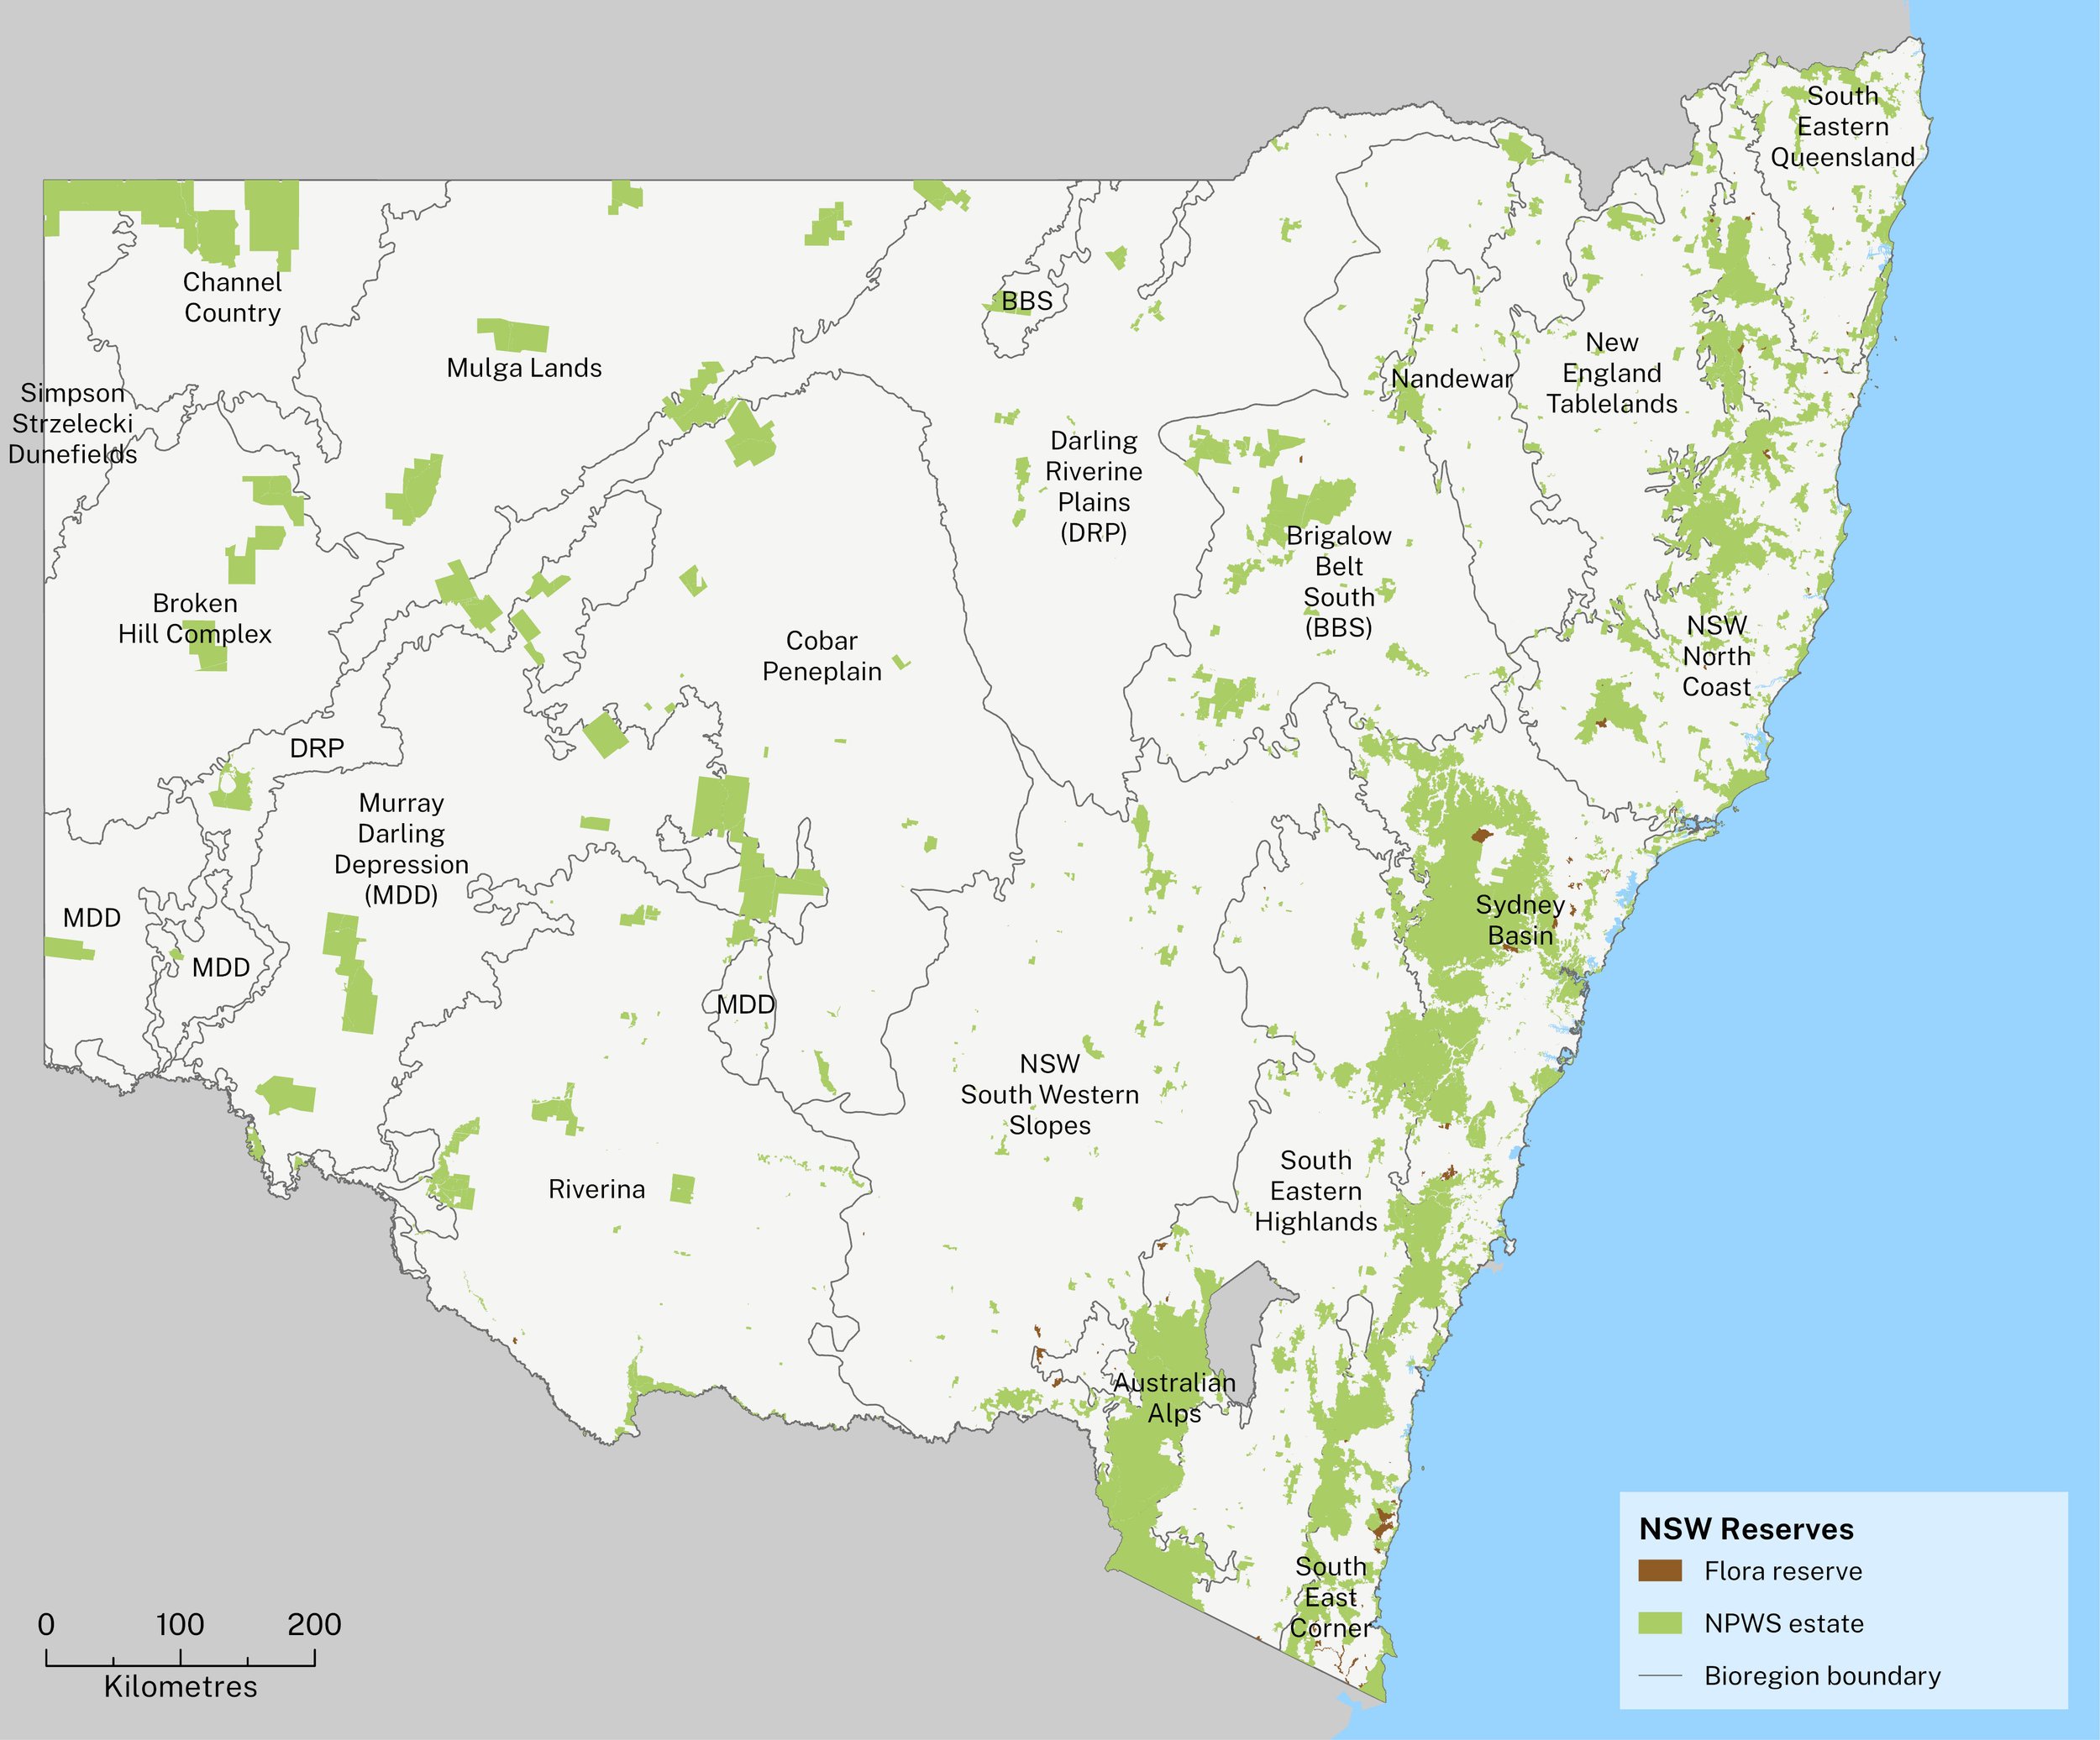
Figure 1. The 18 IBRA bioregions of New South Wales, with the NPWS reserve estate for context. The Biodiversity Offsets Scheme trades at the finer subregion level within them.
Source: NSW State of the Environment, "Protected areas and conservation 2024" (NSW DCCEEW).
Cleaned market transfers moved about 16,100 ecosystem credits for roughly $79.5 million in the year to March 2026. That activity is highly concentrated. Four bioregions account for almost all of it: the NSW North Coast and the Sydney Basin, each around $22.6–22.7 million, the NSW South Western Slopes at $19.8 million, and the South Eastern Highlands at $9.5 million. Every other bioregion is comparatively marginal, and several with substantial credit holdings recorded no market trades at all.
Where the market is active
Cleaned market transfers moved about 16,100 ecosystem credits for roughly $79.5 million in the year to March 2026. That activity is highly concentrated. Four bioregions account for almost all of it: the NSW North Coast and the Sydney Basin, each around $22.6–22.7 million, the NSW South Western Slopes at $19.8 million, and the South Eastern Highlands at $9.5 million. Every other bioregion is comparatively marginal, and several with substantial credit holdings recorded no market trades at all.
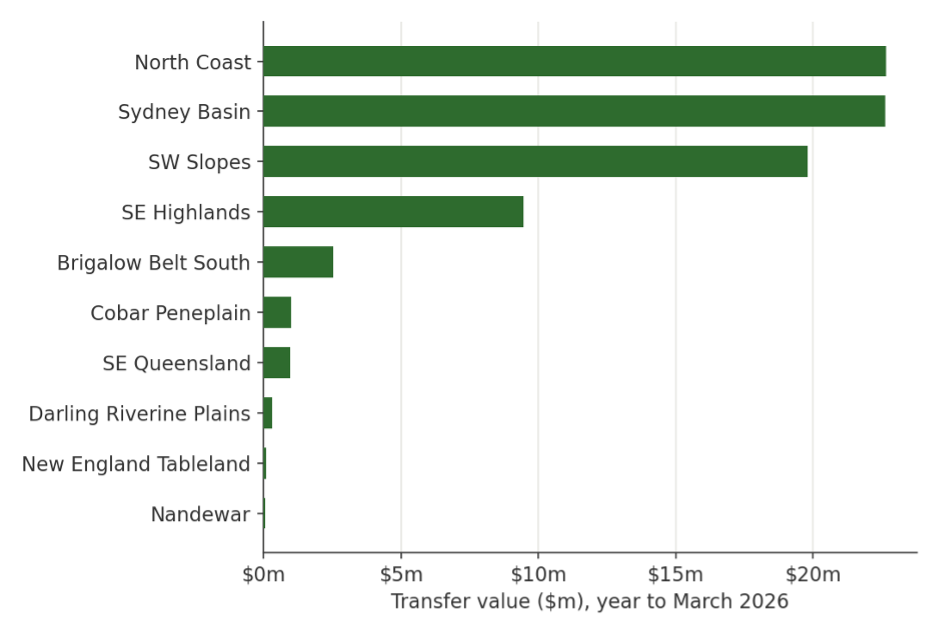
Figure 2. Cleaned BOS ecosystem transfer value by bioregion, year to March 2026. All bioregions with BOS data shown; coastal bioregions shaded darker. “nil” marks bioregions that hold credits but recorded no market trades
Generating credits on the coast means securing and managing conservation land where values are high, where intact parcels suitable for offsetting are scarce, and where the long-term cost of managing a site for conservation is greater. The price of a coastal credit reflects what it costs to create and hold the offset, not simply how many buyers are competing for it.
Why the coast is dear
Average prices climb steeply from the interior to the coast. Far-inland credits that trade at all change hands near $1,900–$2,400; Southwestern Slopes and Southeastern Highlands credits sit around $3,800–$4,200; North Coast credits average above $5,100; and Sydney Basin credits average close to $9,700 — with Western Sydney's Cumberland subregion above $30,000
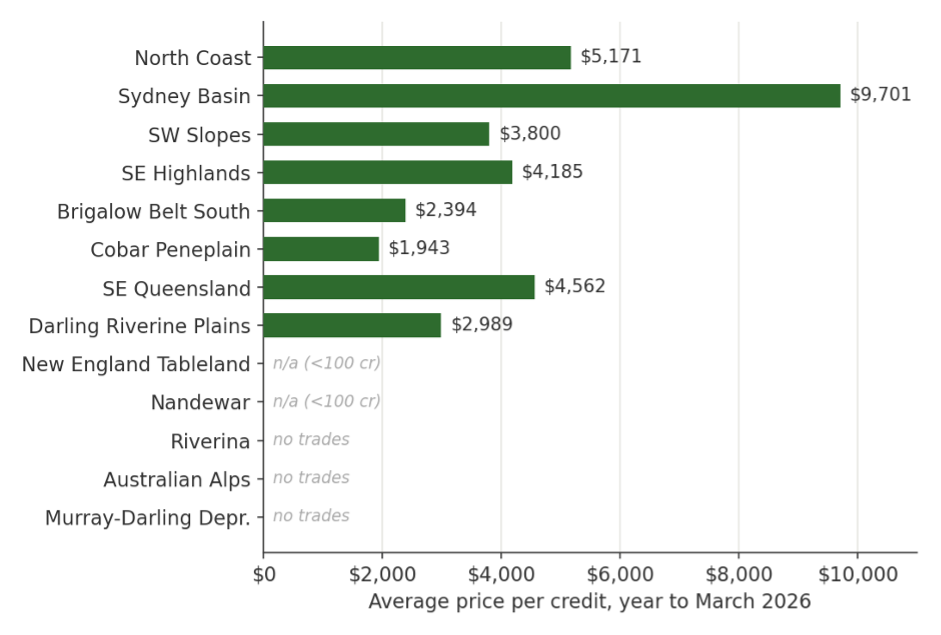
Figure 3. Average price per credit by bioregion, year to March 2026. Averages are suppressed where fewer than 100 credits traded (shown “n/a”), as a handful of trades produce an unreliable mean.
Generating credits on the coast means securing and managing conservation land where values are high, where intact parcels suitable for offsetting are scarce, and where the long-term cost of managing a site for conservation is greater. The price of a coastal credit reflects what it costs to create and hold the offset, not simply how many buyers are competing for it.
The inland holdings are held, not traded
The most important thing the bioregion view corrects is a misreading of inland “supply.” Several inland bioregions sit on large issued credit holdings while showing almost no market trading. Brigalow Belt South holds the largest issued volume in the state — about 87,000 credits — yet only around 1,000 traded on the open market last year. The Murray-Darling Depression holds some 73,000 and the Riverina some 46,000, with essentially no arm's-length transfers at all.
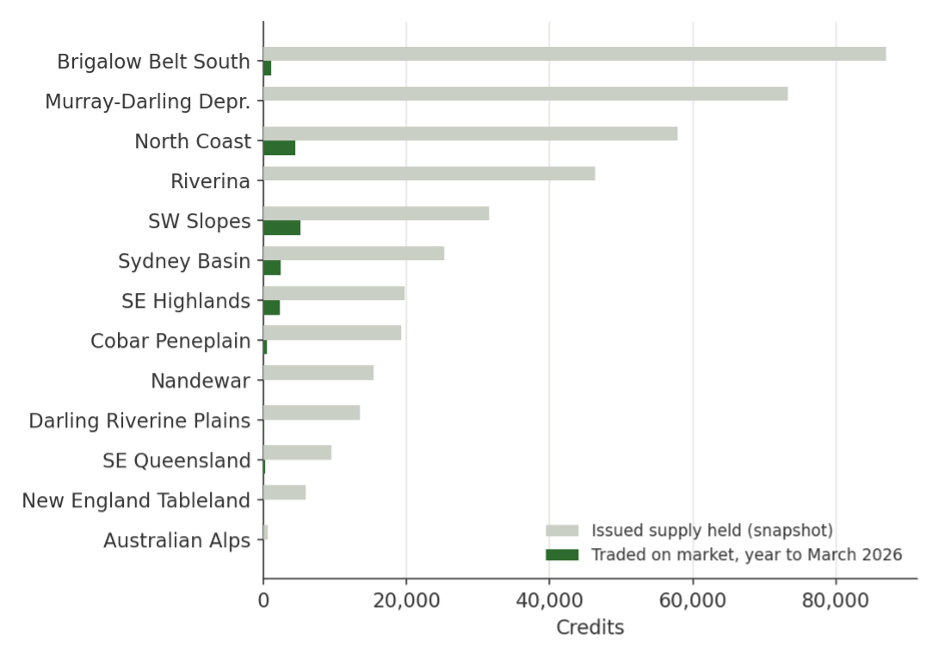
Figure 4. Issued credits held (current register snapshot) versus credits traded on the market in the year to March 2026, by bioregion, in credits.
This is not a market failing to clear. These holdings are largely credits generated or secured by major project proponents — Inland Rail, large-scale solar and wind, transmission, and mining — against their own future retirement obligations. They are inventory held until needed, not stock offered to the market. Reading a large inland holding as available supply, or its low turnover as illiquidity, mistakes a balance sheet for an order book. It also explains why inland retirements can be substantial even where trading is negligible: proponents are acquitting obligations from credits they already hold, rather than buying them in the open market
How the picture has shifted
Over three years the market has both contracted and rotated. Cleaned transfer value has fallen from above $180 million in 2023-24 to under $80 million in 2025-26 — but much of that earlier height was a single concentrated episode rather than a broad market. Brigalow Belt South alone moved more than $100 million of credits in 2023-24; that activity has since all but disappeared, leaving the large held inventory behind.
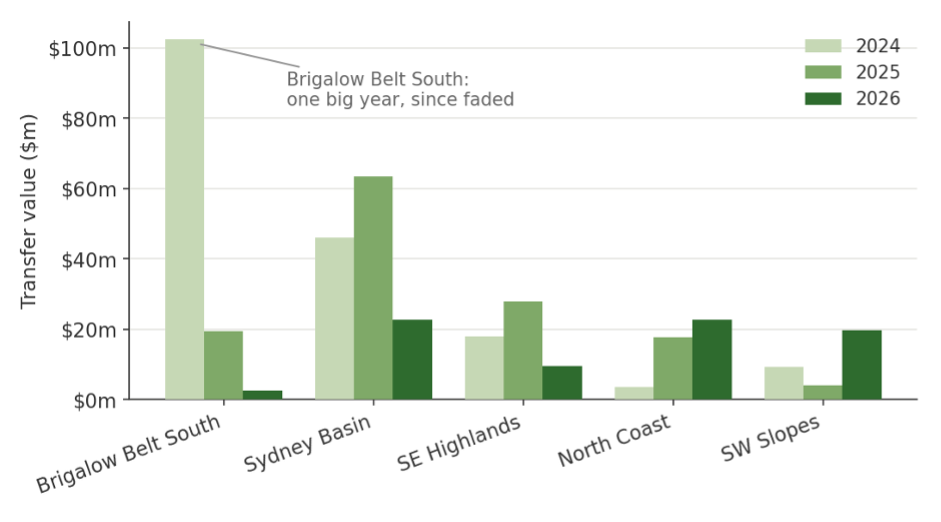
Figure 5. Cleaned transfer value by year to March for the main trading bioregions
Remove the activity and a clearer trend emerges: activity has migrated toward the coast and the southern slopes. The NSW North Coast is the standout — the only major bioregion to rise in every year of the window, and now the single largest source of transfer value in the state. The South Western Slopes jumped sharply in the latest year and carried the heaviest retirements of any bioregion, consistent with the renewable-energy build-out moving through that corridor. The Sydney Basin remains a high-value market throughout, though down from its 2024-25 peak.
Inside the active bioregions
Bioregion totals still hide a lot. Within each of the active markets, trading concentrates in just one or two subregions — and which ones are moving has changed over the three years. The patterns below matter to anyone holding or seeking credits in these areas, because the matching rules mean a subregion is often the real market, not the bioregion above it.
Sydney Basin — a high-value market thinning to its core
Cumberland is the Sydney Basin. Western Sydney alone accounted for $55 million of trades in 2024-25, easing to $14 million last year as volume thinned, and at above $30,000 a credit it is the most expensive subregion in the state. The Hunter is the only other consistent market, trading nearer $4,000. Everything else is sporadic, and Kerrabee, Illawarra and Jervis hold credits without recording a trade at all.
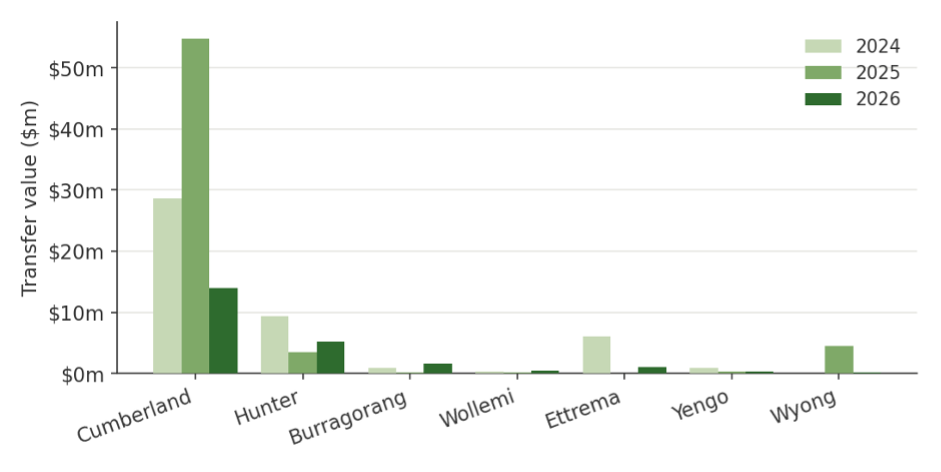
Figure 6. Sydney Basin transfer value by subregion and year. Cumberland (Western Sydney) dominates throughout.
South Eastern Highlands — concentrated in Hill End
The South Eastern Highlands is almost a one-subregion story: Hill End drove the bioregion's 2024-25 surge to $24.6 million and remains its core market at $8.4 million in the latest year. Monaro provides a secondary, declining market, and the remainder Bondo, Crookwell, and Murrumbateman trade only in small parcels. The bioregion's rise and fall over the window is essentially Hill End's.
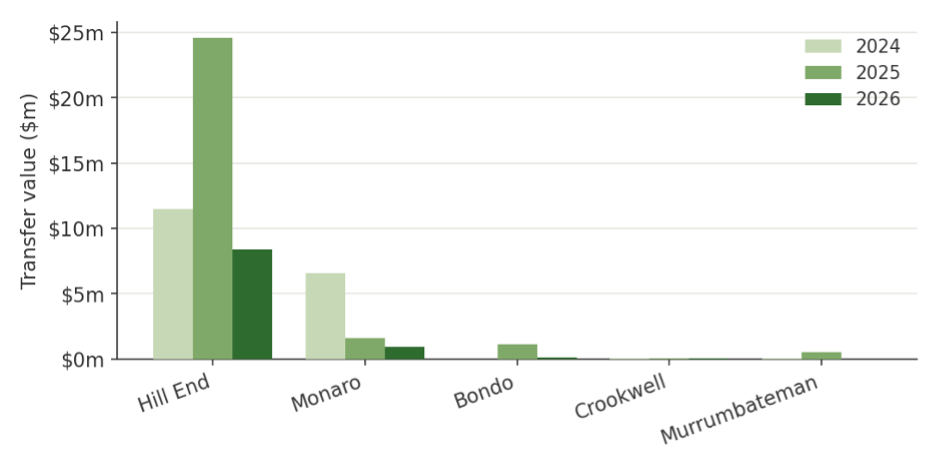
Figure 7. South Eastern Highlands transfer value by subregion and year.
North Coast — the broadening growth market
The North Coast is the most encouraging picture in the state, and unusually it is not reliant on a single subregion. Karuah Manning is the anchor — trading consistently and holding by far the largest credit inventory in the bioregion (around 38,000 issued credits) — while Ellerston has grown from nothing to a $11.6 million market in two years. Upper Hunter and Mummel Escarpment have begun trading more recently. The breadth, not just the level, is what marks the North Coast out: growth is coming from several subregions at once, which is part of why it has overtaken the rest of the state on value.
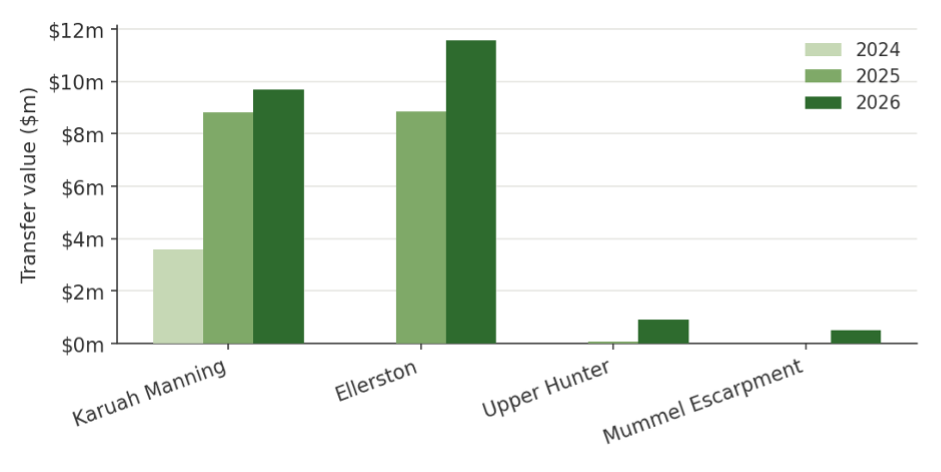
Figure 8. NSW North Coast transfer value by subregion and year
What it means
For buyers, the lesson is that location sets the price, and the difference is an order of magnitude: an obligation that can only be met in Cumberland or the Hunter sits in the most expensive, thinnest part of the market, while one that can reach inland supply pays a fraction as much. For credit generators, the active subregions — the coast and the southern slopes, and within them Cumberland, Hill End, Karuah Manning and Ellerston — are where genuine market demand is pulling. And for anyone reading the market as a whole, the single statewide average is close to meaningless: it blends a $30,000 Western Sydney credit with a $1,900 inland one, and a held inland inventory that never reaches the market at all.
The data and analysis presented are drawn from multiple sources, including: NSW Government public registers (such as the BOS Credit Transaction Register and Biodiversity Conservation Fund Charge Quote Reports), Biodiversity Conservation Trust (BCT) reports, and Other publicly available or Speargrass-compiled datasets. The data has been cleaned for non arm's lengths trades. Years are not calendar years. For pricing, valuation or bespoke information on a specific credit, contact Speargrass.