
Market Update - NSW BOS Q2 2026
Over the twelve months to June 2026, BOS ecosystem prices rose and BOS species prices held while trading volume fell in both markets.
Ecosystem trading thinned with fewer more concentrated trades and Species slowed with a spread across more credit types in smaller parcels..
The headline measures across all four credit market segments are seen in the tables below.
Credit prices (per credit, rolling 12 months)
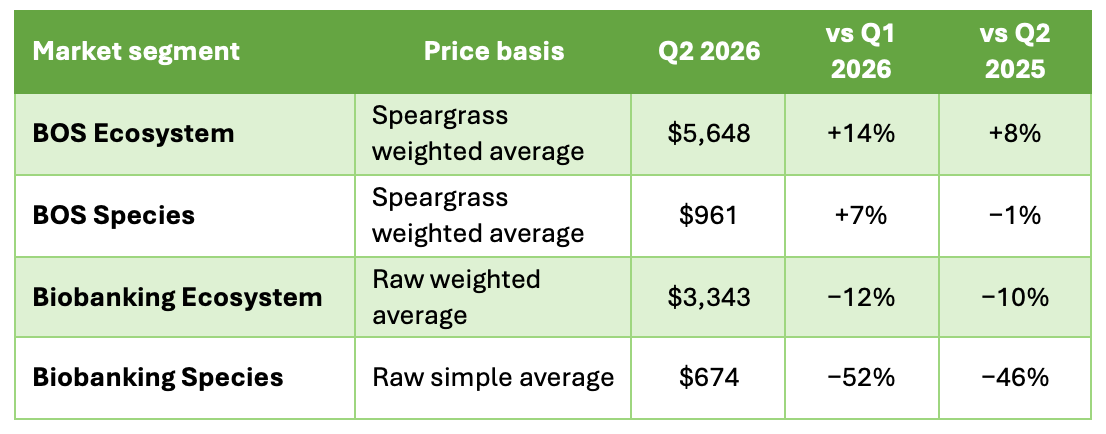
Table 1: Overall price trends in BOS markets
Transfer volume and retirements (rolling 12 months)
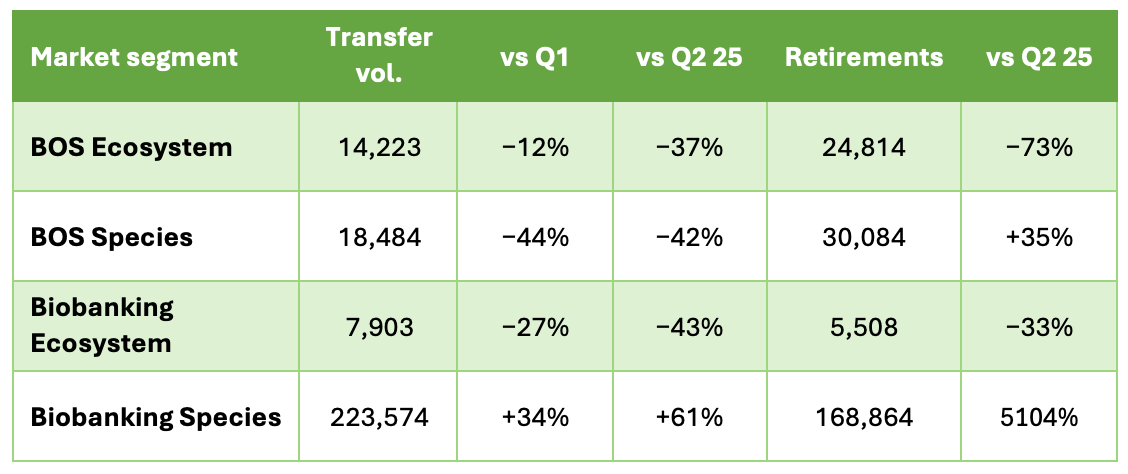
Table 2: Market activity trends in BOS markets
BOS prices and transfer volumes are Speargrass figures with non-market transfers removed. Biobanking figures are raw.
Ecosystem Price Average Increase
The BOS ecosystem weighted average price rose to $5,648 per credit, up 14% from the last quarter and 8% on a year earlier.
This change is because higher-value credit types made up more of what changed hands over the period.
With 387 credits of Cumberland Plain Woodland in the Sydney Basin Bioregion trading in the quarter with an average credit value of around $38,000 per credit.
While individual credit price averages are less affected, this volume of high costs credits has shifted the average in the past quarter.
Trade Decline
The rolling transfer volume declined sharply for both markets.
Ecosystem credits aren’t being traded as much with transfer volume is down 37% since this time last year. Ecosystem trading also concentrated in a smaller number of markets.
The five most-traded Offset Trading Groups accounted for the bulk of volume, led by the most active market - White Box Yellow Box Blakely's Red Gum Grassy Woodland and Derived Native Grassland.
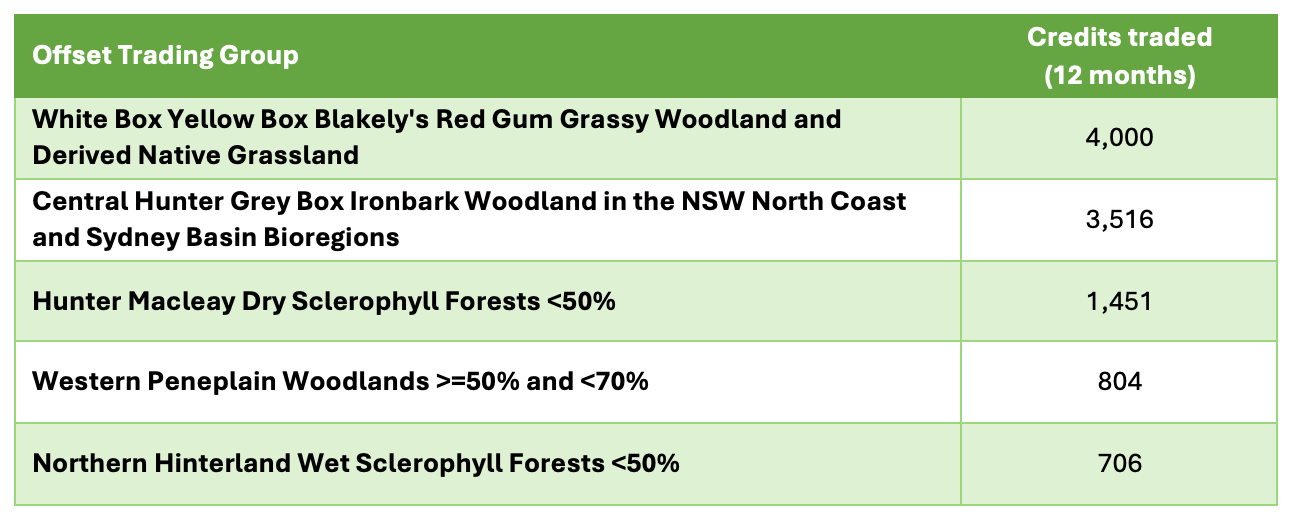
Table 3: Most traded Offset Trading Groups in the last 12 months
Species market trade volume has also declined over 40% across the quarter and the year.
Species trade counts decreased by 9%.
Species markets are more diverse than ecosystem credits. Koala leads by volume (Table 4)
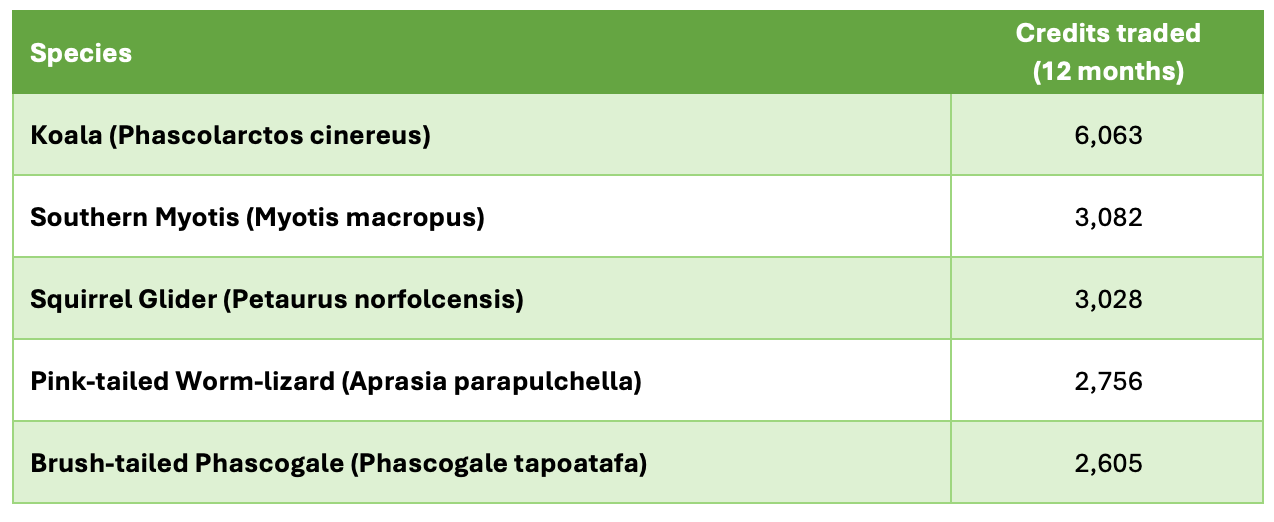
Table 4: Most traded species markets
Trade volume has declined over the past 12 months; in species markets that’s due to smaller credit volumes across a slightly lower trade across a broader range of markets whereas in ecosystem markets trade has concentrated into several key markets.
Supply Increase
At the same time much more supply is coming online across the scheme.
Species supply is set to almost double. There are 480,021 pending species against 585,861 already issued.
A 25% increase in ecosystem supply is also on hand. There are currently 202,153 ecosystem credits pending against 409,149 issued.
That pipeline lands into markets where trade is already falling.
A near-doubling of issued species supply, arriving while species trade volume is down 42% on the year, gives holders little reason to expect prices to climb.
The ecosystem lift is smaller but it enters an even thinner trading market.
Overall this should make it easier to meet obligations and place downward price pressure in many markets.
What it means for participants
Ecosystem prices rose, but they rose because higher-value credits made up more of what traded, not because the market lifted across the board.
With ecosystem trade thinning and supply barely changed, prices are more likely to hold or decline slowly and sales may take longer to find.
Species is the busier market, with more credit types changing hands, which sellers more chance in the market but, with supply rising, there is less reason to expect prices to climb.
A holder with no near-term sale in progress, and a landowner weighing a new agreement should not assume today's prices will hold.
However, the overwhelming insight for the BOS is that it is many markets with diverse supply and demand dynamics.
Speargrass can help you understand the market conditions that matter to your development or your holdings. Reach out to chat anytime.
