
We valued every credit in the market and the results are eye-opening
The nominal value of a biodiversity credit is what it should trade for today. It is the number that appears on registers, on dashboards and in most quick calculations of price against the market.
A discounted value is what those credits are worth today, once the likely timing of a sale is considered. Many credits take years to sell, and some will never sell and their real value is far below the nominal price.
As part of developing our valuation service, we discounted every credit to see where total value sits right now in the market.
Valuation Method
For this article, Speargrass used the income valuation approach approved by the Australian Taxation Office (ATO), which values an asset by reference to the future economic benefits it is expected to produce, converted to a present-day figure. The method applies a discounted cash flow assessment: it takes the proceeds a holding is expected to generate, weighs when and how reliably they might be realised, and discounts them back to a present value at the valuation date. The discount rate used here is 15%. Supply for the valuation is on-market supply — the supply realistically available to a buyer, not every credit on the register.
All valuations are estimates based on current market data and are not official valuations.
One fifth of headline value
We estimate that the discounted value of credits in the BOS market is only 22% of the nominal value, based on historical demand and current supply.
The two BOS credit markets tell this same story at different scales (Figure 1).
On the ecosystem side, the on-market pool carries a nominal value of about $868 million. Its estimated present value is about $280 million, close to 32 percent of nominal.
For species the gap is wider with a nominal value of about $701 million that falls to an estimated present value of about $72 million, close to 10 percent of nominal.
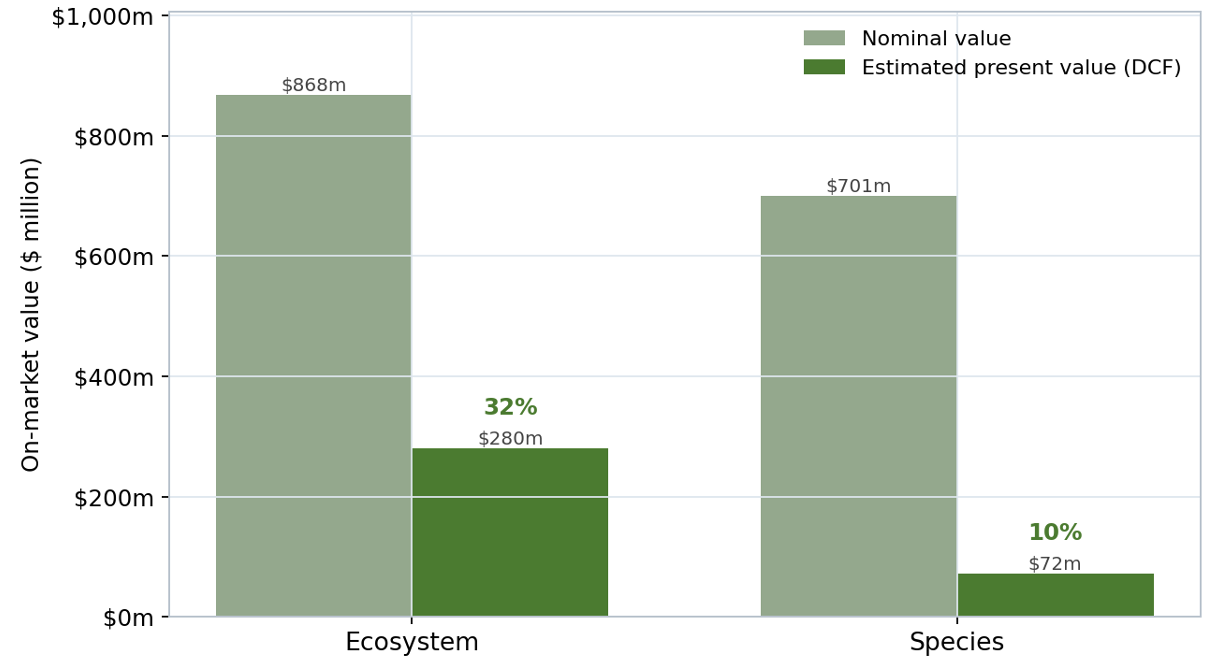
Figure 1: BOS Markets nominal and estimated present value
Time to sell is the key factor
The longer a market would take to sell the credits currently available in it, the less of its nominal value survives.
Figure 2 shows each ecosystem credit markets estimated time to clear and its discounted value as a percentage of the current nominal price. Figure 3 shows the same for species.
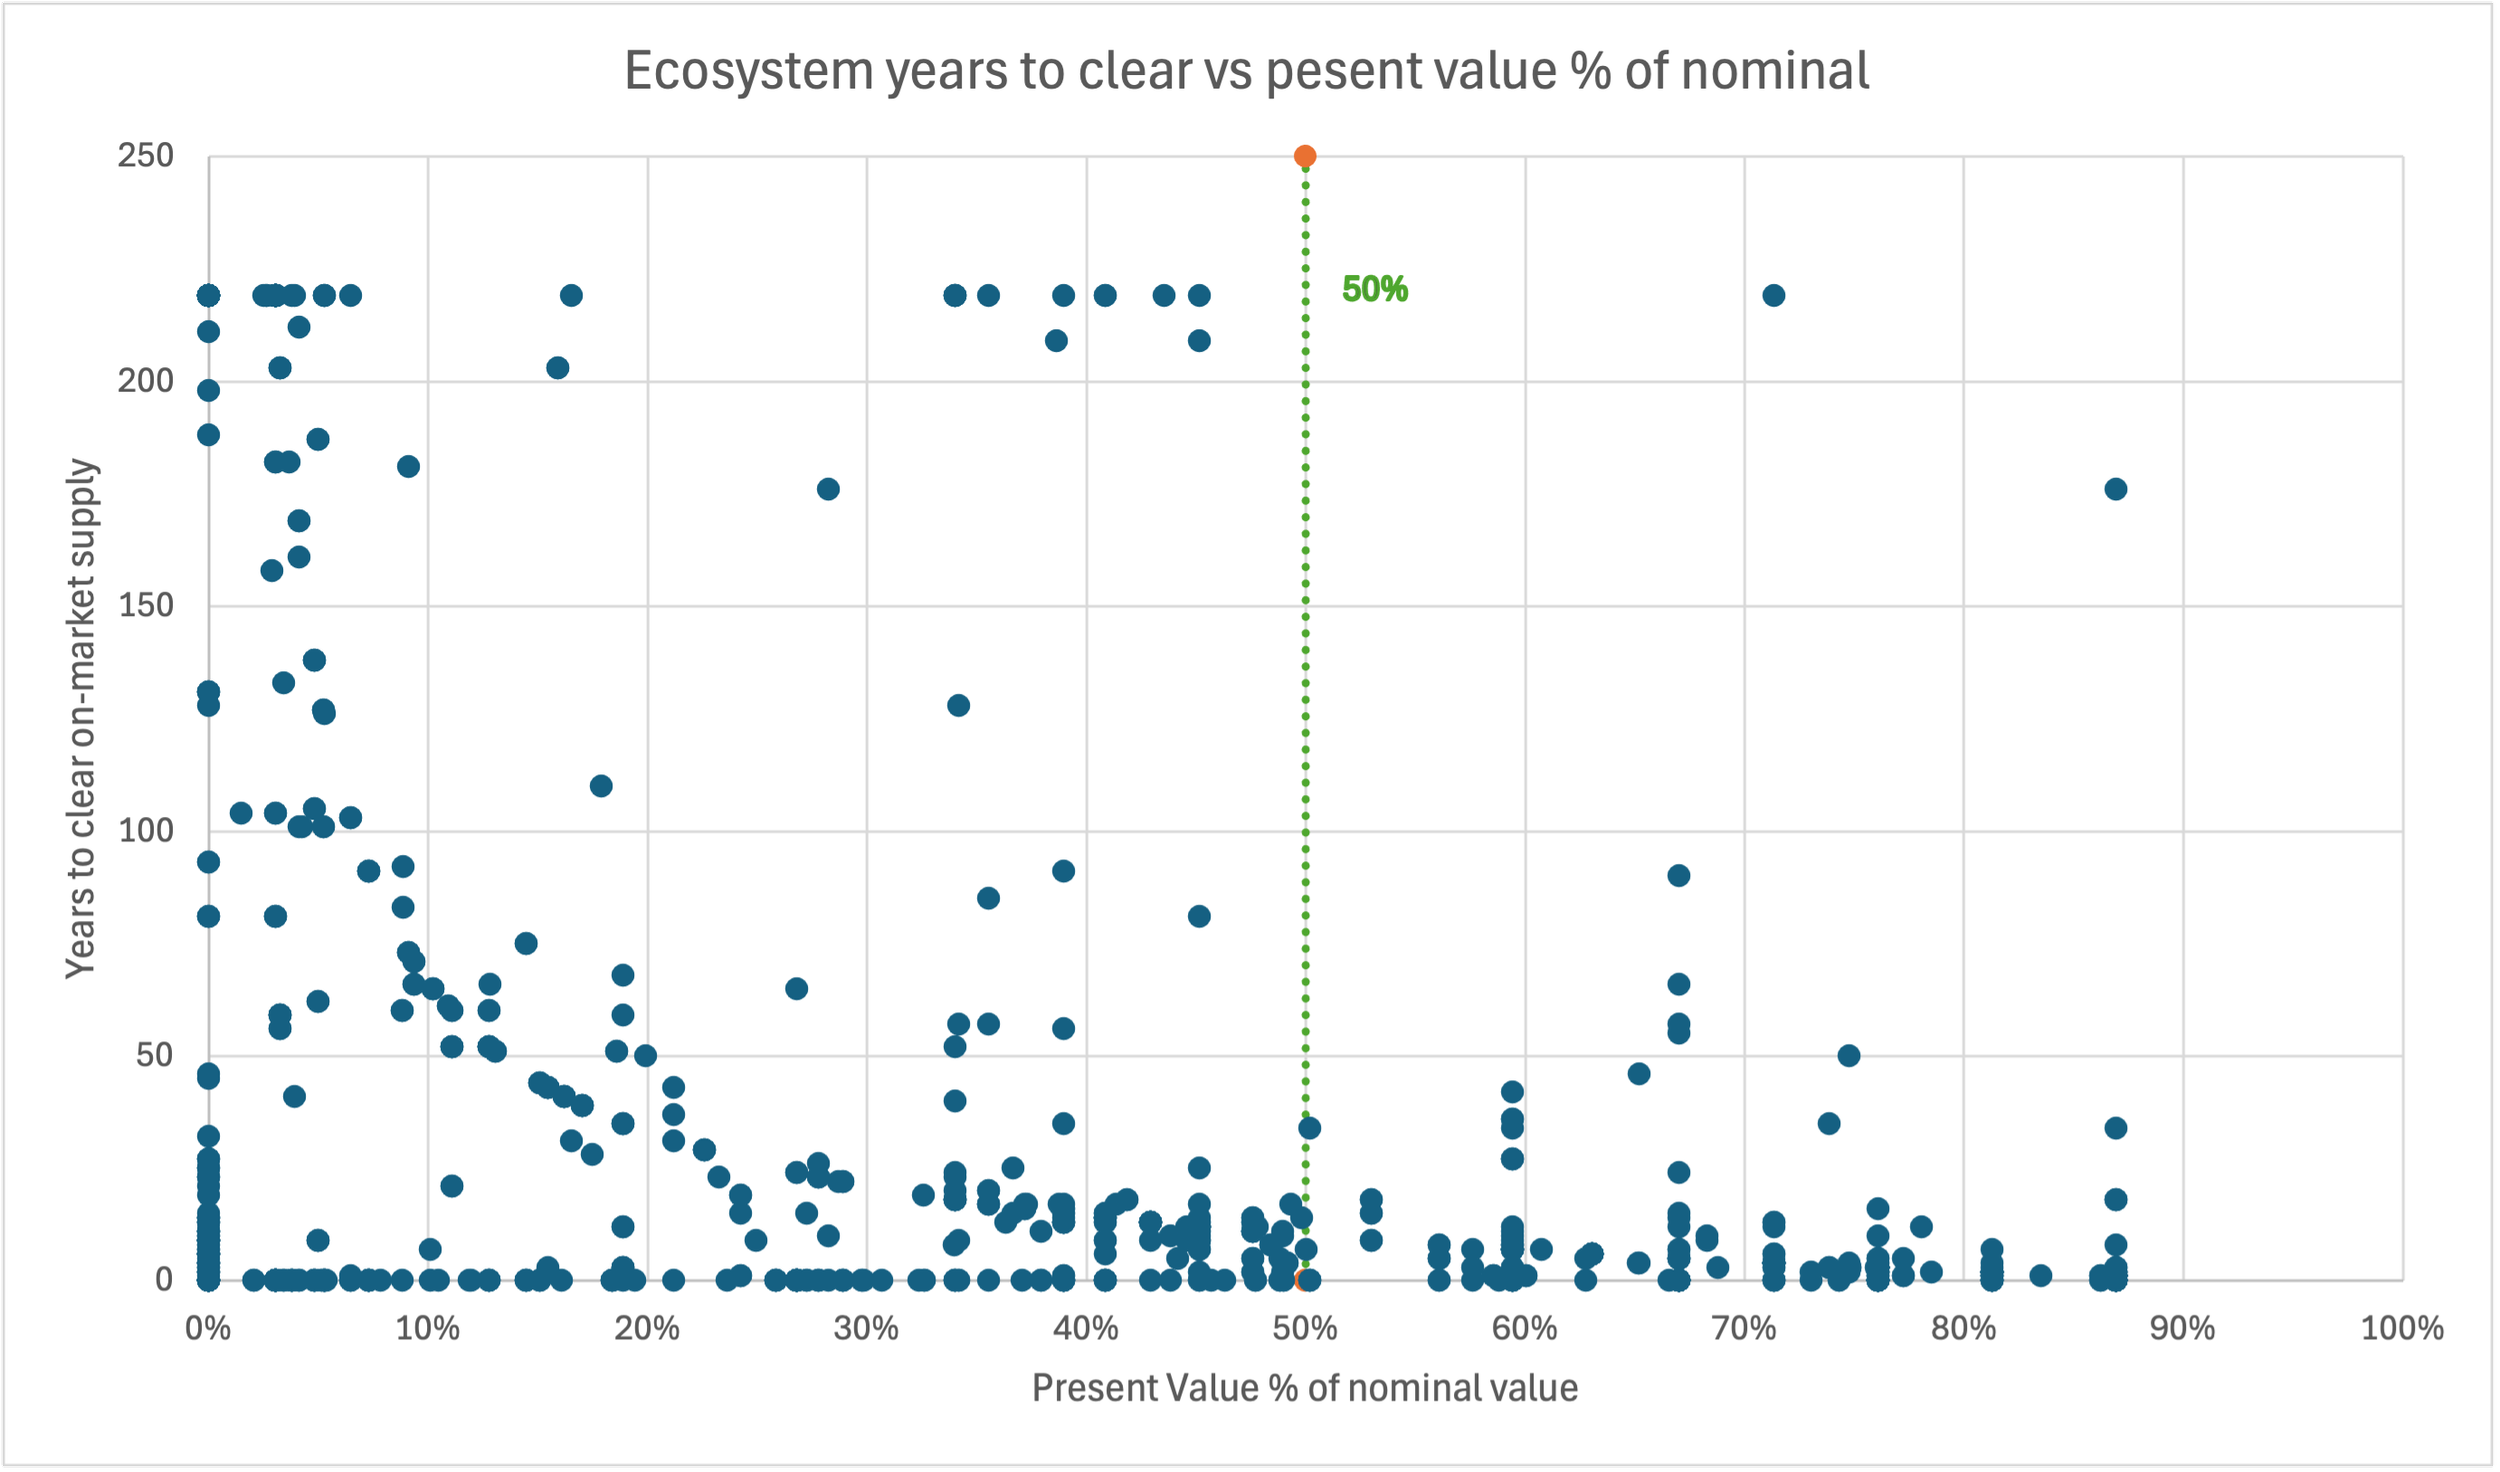
Figure 2: Ecosystem present value percentage of nominal against year to clear supply
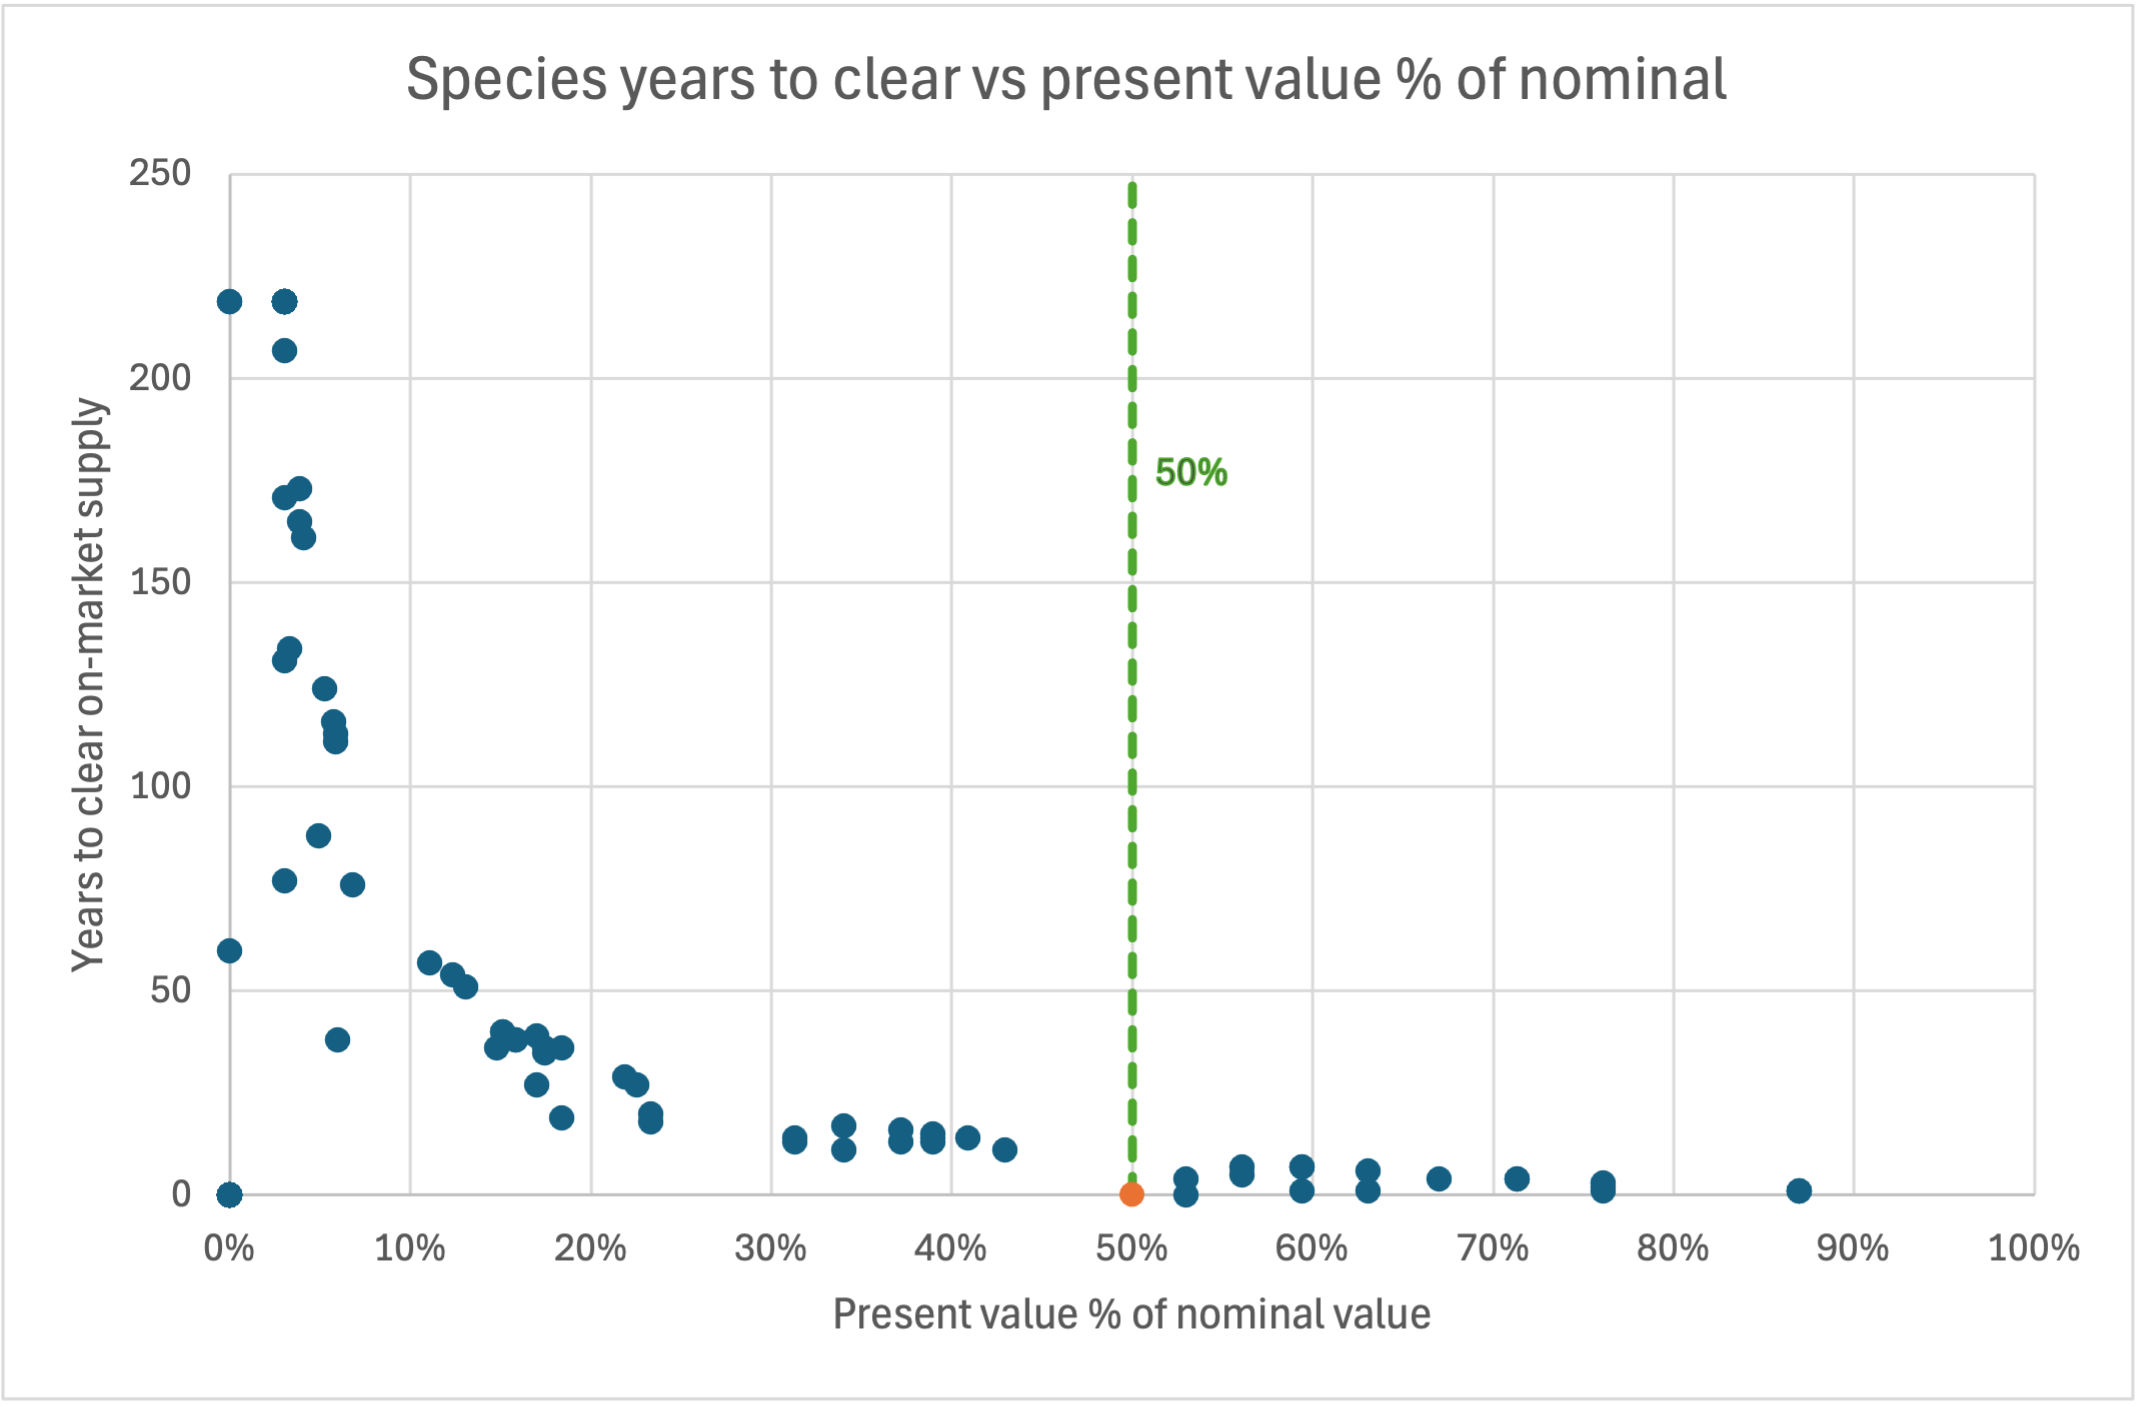
Figure 3: Species present value percentage of nominal against year to clear supply
A market at 90 percent discounted value is an indication it is close to being liquid (able to be sold as required) and history suggests credits will trade quickly and the market needs constant new supply.
A market at 5 percent is one where there is very limited demand or way too much supply and any opportunity to sell needs to be valued accordingly.
Credits that clear within five years hold around 70 percent of their nominal value at the discount rate used in the analysis.
Between five and ten years that share falls to about 54 percent for ecosystem credits and 60 percent for species.
From ten to twenty-five years the two markets diverge: ecosystem credits retain around 43 percent while species fall further to about 34 percent.
Beyond twenty-five years and a credits value is very marginal tending to zero.
Is 50 percent of nominal a viability line?
The 50 percent line is potentially a crucial value for credit owners.
Credit generation can be a costly endeavour between ecological surveys and ongoing management fees required for the Total Fund Deposit.
A feasibility benchmark for any BSA is whether the present value of a market covers enough of its nominal value to make a sale worth completing after those costs.
Present value at or above half of nominal is a reasonable marker for a market where cost recovery is realistic. Below it, the economics of transacting and credit feasibility lessens.
Using this measurement, most markets fall short (Figure 4).
Among the ecosystem markets that carry a present value, 64 sit at or above half of nominal and 113 sit below,
One in three ecosystem markets reach the point where cost recovery is comfortable.
On the species side, of the markets that carry a present value, 18 sit at or above half of nominal and 56 sit below.
Only around one in four species markets reach the point where cost recovery is comfortable.
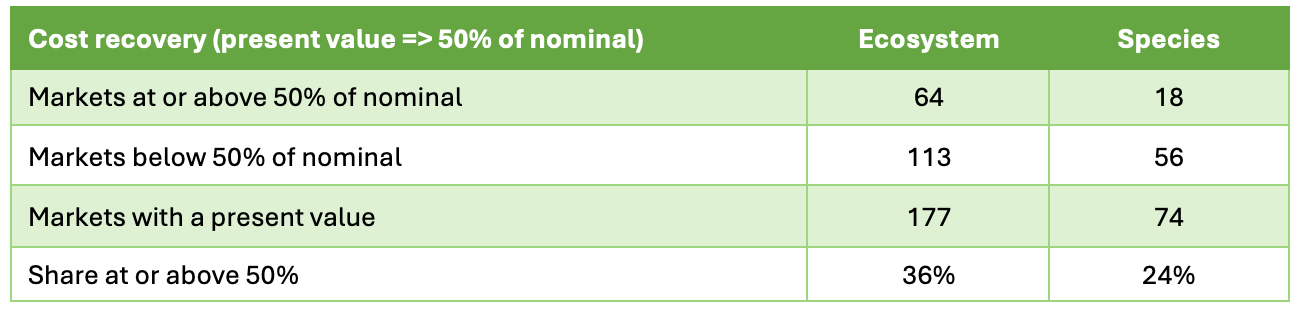
Figure 4: Markets with current present value cost recovery
The credits that are worth nothing today
Some markets carry a nominal value and a present value of zero at the same time (Figure 5).
This happens where a credit type has supply and a price, so nominal value is above zero, but no trading history, so there is no basis to place a realistic sale in time.
With no modellable sale, the present value comes out at zero. On paper the market has value but it is not reflected today.
These markets are not rare. Among the ecosystem markets with an on-market nominal value 30 have a present value of zero, about 14 percent. Similarly, among the species markets with a nominal value, 18 have a present value of zero, about 20 percent. Every one of these contributes to the nominal headline and nothing to the present value total.
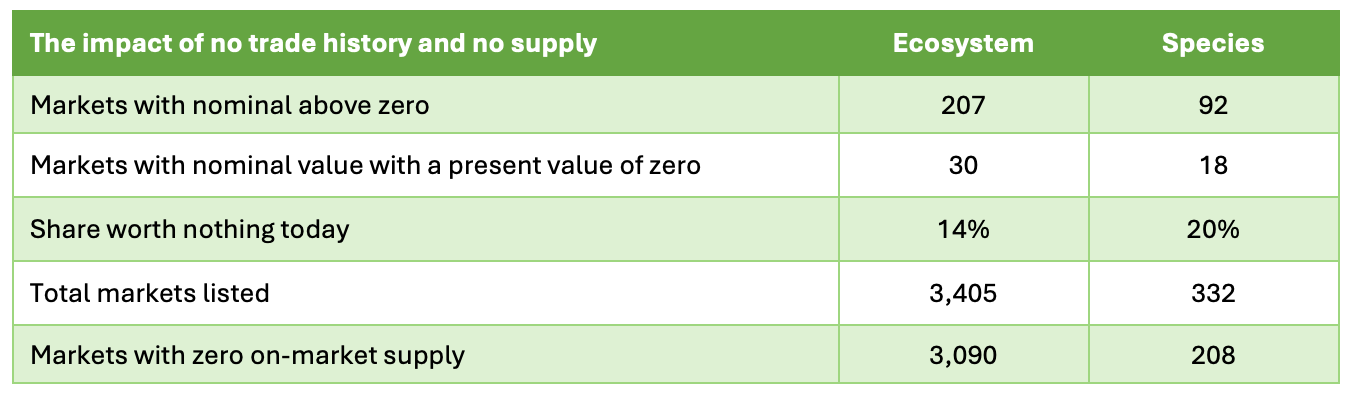
Figure 5: Impacts of trade history and supply on present value
The wider pool sits behind those numbers.
Of the 3,405 ecosystem subregion markets, about 91 percent have no on-market supply at all.
Of the 332 species markets, about 66% have none.
A market with no supply can still carry an inferred price, but a price with nothing to sell behind it is not a tradeable asset.
These empty and untraded markets are what pull the average share of nominal value down and open the gap between what a market looks like on paper and what it is worth today.
How Speargrass can help
Markets are volatile as specific demand can change significantly if new project approvals come online.
Speargrass values credits on a present-day basis across the whole NSW market, market by market and subregion by subregion, so a holder or buyer can see what a credit is worth now rather than what it looks like on a register.
For a valuation or a market read on a specific credit type, contact Speargrass.
Figures are drawn from Speargrass interpretation of data within the NSW BOS registers.
